 |
|

|
AeroTech’s CONOPS for pilots, dispatchers and controllers Prepared by Dr. Paul Robinson - September 2014 1. Background Several recent developments have rekindled the aviation community’s wish for better and more integrated turbulence avoidance information, and better air/ground coordination. 1.1 Airborne Turbulence Radar In 2012, the FAA published TSO C63d with Minimum Operational Performance Standards for certifying the enhanced turbulence (E-Turb) mode airborne weather radars. An example of this type of radar display is depicted in Figure 1. This display was developed by AeroTech, NASA, and Rockwell Collins and flown on a Delta Air Lines B-737-800 in operational service for 2 years. 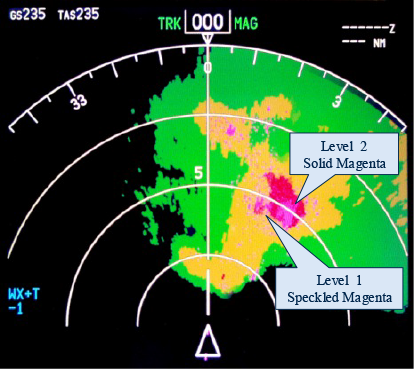 Figure 1: Cockpit Presentation of Turbulence by the E-Turb Radar Two levels of turbulence are depicted: Level 1 – light to moderate, “seat belt sign on”, and Level 2 – severe or greater, “avoid”. Radars are now being certified to this TSO standard and are being very well received by pilots. 1.2 Integrated Displays of In Situ Turbulence Reports from Aircraft with Other Weather and Operational Data AeroTech’s partner WSI has integrated real-time turbulence reports from aircraft equipped with the Turbulence Auto-PIREP System (TAPS®) into its Fusion™ dispatcher tool, as shown in Figure 2. 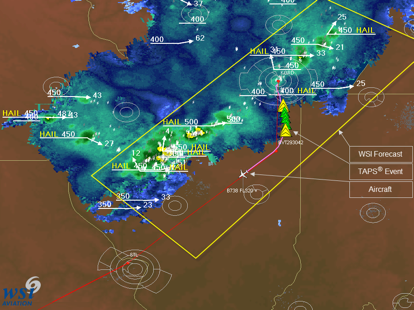 Figure 2: WSI's Fusion™ Dispatcher Support Tool Dispatchers can now see weather observations (e.g., Nexrad), real-time turbulence reports (TAPS), and airspace and traffic information. This allows efficient decision-making for turbulence awareness and avoidance. 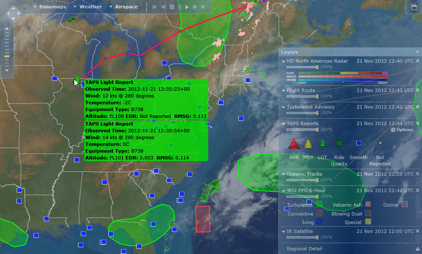 Figure 3: WSI's PilotBrief® Cockpit Display Another advance has been made in the understanding of situ turbulence reporting methodology. The FAA recently convened a team to evaluate existing implementations and develop performance standards. The final report is available upon request. In addition, the FAA and Delta Air Lines have also evaluated tablet-based turbulence displays for the cockpit, and FAA is developing NEXRAD-based turbulence products. With the use of the turbulence awareness technologies shown above and others, it is now possible for pilots, dispatchers, and controllers to share the same “picture” of turbulence information: reports and forecast. With this greater awareness of turbulence hazards available to stakeholders, questions arise as to how best to use this information and what actions are required? 2. The Need For CONOPS A general depiction of the flow of turbulence “information” is presented in Figure 4. The flow includes two elements of the Air Traffic Control System, controllers and flow managers, the flight crew and, in airline operations, the dispatcher. The communications channel between the flight crew and the dispatcher, and between the control facility and the flow management facility, are generally used during flight planning. Flow control may block out areas of airspace and dispatch may alter flight plans based on turbulence forecasts or PIREP data. 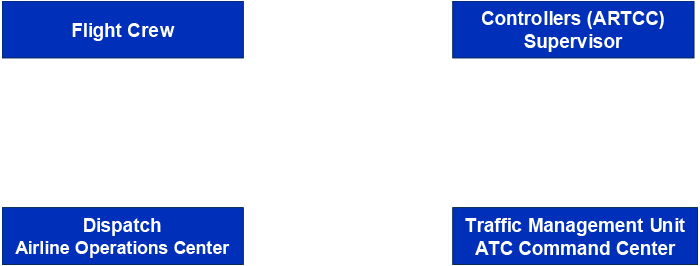 Figure 4: Current Turbulence Information Flow Thus, most of the real turbulence avoidance in this mode of operation in today’s system occurs in the communications channels between the flight crews and controllers. Pilots provide ride reports on the sector frequency and the controllers relay this information with location information to other pilots who use the information to make route change or deviation decisions and then provide ride reports of their own. With the new technologies mentioned in the previous Section, all four groups can have a very similar, real-time “picture” of the turbulence hazards. The analysis of changes to the current system is what is developed in the CONOPS. AeroTech’s CONOPS are divided into two documents:
The audience for the CONOPS ranges from subsystem designers to aircraft manufacturers, air carriers, pilots, air traffic controllers, dispatchers, researchers, and regulators. The CONOPS were developed using groups of subject matter experts and are necessarily detailed as the systems and interactions are complex. Each CONOPS consists of the following elements:
Each CONOPS presents operational scenarios, based on actual conditions, to show how the new systems may work. These scenarios are summarized below. 2.1 Operational Scenario: Integrated Turbulence Hazard Decision Aid for the Cockpit. The cockpit display CONOPS presents the integration of airborne radar E-Turb information with real-time in situ turbulence reports from other aircraft. Part of the cockpit display CONOPS development used extensive simulation testing with pilots in an A320 flight simulator. Pilots were tasked to navigate around convection using the radar and turbulence report information. . 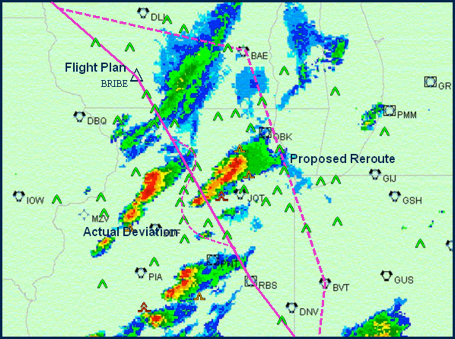 Figure 5: Actual Deviation Path Versus Proposed Reroute Path Figure 5 shows the operational scenario based on actual flight conditions. The planned flight path is shown as the solid magenta line. The convective reflectivity is also shown. A reroute, suggested by ATC is shown in the dashed magenta line labeled “Proposed Reroute”. However, using the integrated display, the pilot was able to take a more direct route, and the actual path is shown as the dashed magenta line labeled “Actual Deviation”. The aircraft transited the region of convection safely without encountering significant turbulence or having to follow as great a deviation as suggested by the Proposed Reroute. 2.2 Operational Scenario: Integrated Turbulence Hazard Decision Aid for Controllers and Dispatchers In the dispatcher and controller CONOPS, a similar scenario was considered. Figure 6 shows the example used. This was based on an actual traffic and convective weather scenario. The original flightpath is as shown. Due to the convection, the flight between Atlanta and Dallas is required to deviate far south to get around the weather. With enhanced turbulence information (particularly real-time in situ reports) the dispatcher and controllers know where the severe turbulence is, and can allow a more direct deviation around the weather. 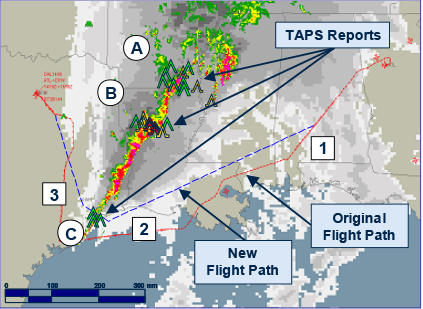 Figure 6: Future Operations with Turbulence Hazard Decision Support Tool In the example above the in situ reports (green, yellow, and red carets) show regions of moderate (yellow) and severe (red) turbulence through the middle and to the north of the convective line. The aircraft still has to deviate to the south, but can transit the convective line further north saving time (and fuel) en route. Both examples are explained in greater detail in the CONOPS documents. 3. Next Steps Given the maturity and availability of new turbulence awareness technologies in the cockpit and on the ground, there is now a need to combine the use and application of the information. Collaborative decision-making between the cockpit and the ground using the same turbulence “picture” could provide great efficiencies and enhanced safety of operations. In addition, NextGen has some clear objectives regarding the operation of the National Airspace in the future. The objectives will need to be met (as much as possible) even as they accommodate hazards to aircraft such as turbulence. With these needs in mind, the CONOPS discussed in this White Paper should be used for two purposes:
More details can be found in the documents accessed through the links on the right side at the top of this page. |
CONOPS Downloads
 CONOPS for Turbulence Avoidance and Decision Making  Concept of Operations for an Integrated Turbulence Hazard Decision Support Tool for Controllers and Dispatchers  Concept of Operations for an Integrated Turbulence Hazard Decision Aid for the Cockpit |